Over the years, we experience "good byes" in many different ways. From the first time a toddler, under the watchful care of Grandma, watches Mom and Dad walk out the door to the first day of kindergarten to the first day of college ... the list goes on. In a small sense, completing this class is the same way ... there's a sense of completion and moving on and reflection back on what has been learned and accomplished over the last seven weeks. Here are my reflections ...
First, some comments on the class structure. This was my seventh online class at Arcadia University, but the first class where a weekly online class meeting was mandated. Largely as a result of that class time together, I felt a strong sense of being part of a classroom community, rather than taking an online class that - by the way - was also being taken by x number of other students. Bob Stock and I have taken all seven classes together, so we have worked together, talked together, whined together, and certainly have connected throughout our classes. But the fact that we could hear other people's voices and were also compelled to interact with them through projects or blogs increased the sense of community.
Besides the classroom community that Maria created, she also created a sense of being part of a larger education community and mathematics community by the assignments to attend and participate in online webinars each week. Though it was sometimes difficult to connect with these webinars - let's see, if it is 9 am in Australia, what time is it in Pennsylvania?? - I did gain a sense of being part of something bigger than myself. I have always enjoyed being part of something bigger, and this was definitely an asset within the class. Besides the "feeling" of being part of this community, I also had the opportunity to hear from and connect with some high caliber people - Dan Meyer, Don Cohen - who have phenomenal backgrounds and are more than willing to share their learning with part of a larger community.
On a side note, I have many times gotten the sense that many professional teachers are "lone wolves" and happy to be that way. They enjoy being in "their" classroom, doing "their" thing, and are unhappy with anything - be it administrators, new rules / procedures, in service days - which interfere with "their" environment. They create their own worksheets and exams and rarely share any of their prized work with others. After all, it took lots of time to create this stuff - why should I give it away? I have always felt that collaboration in the business world is a positive thing and I believe the same to be true for teaching. I enjoy being able to share things that I have learned with other teachers and have no qualms about sharing knowledge or classroom materials with others. In fact, this week, I turned a couple of my colleagues onto "Jing" as a great way to create webcasts and capture screen images for classroom presentations.
So, what will I take away from this class? I will certainly take away the idea of collaboration and embracing a larger online community. I will make regular use of online videos and "musical interludes" within my classroom. (In fact, I had a trainer this week who made use of music within her one day workshop - great confirmation about the power of music!) I will make use of some of the tools I learned in class - Jing, in particular. I like the idea of being able to create webcasts that I can not only use in my classes, but put online for my students to use to review or reinforce their learning. I will have a higher expectation of my students to make use of the web to perform tasks inside the class and outside of the class.
It is difficult to complete quantify everything that I will take from this class, but there are things that will come up from time to time which will remind me of the adventure. Anytime I see a rafting trip or an escalator, I will think about Dan Meyer. Anytime I hear about a child math protege, I will thing of Don Cohen. And any time I see someone doing great collaborative work, I will think of Maria.
I have enjoyed being part of this adventure!

Welcome to Doug's Blog! This Blog contains a compilation of information created as part of Master's classwork at Arcadia University.
Saturday, August 28, 2010
Wednesday, August 25, 2010
An Evening with Dan Meyer
I attended Dan Meyer's Math 2.0 on Wed evening. Here are the points which I took away from Dan's webinar:
First, Dan used a great "river" picture and analogy to engage the online community from the beginning of the webinar. "Math is a river ... we're all in the same raft taking the journey together. The teacher is the guide." I found myself wondering why he's using the river and why it's significant in mathematics. I may "borrow" this idea for my students at the beginning of the school year!
A few quotes from Dan ...
"If I paddle harder, it means the kids don't have to paddle as hard." Again, consistent with Dan's rafting analogy and a good reminder to me that the person doing the work is the person doing the learning. If I (as a teacher) am working hard, I am learning, but is that the goal? The goal is for my students to do the work ... and the learning. I am the guide!
Engagement in a word problem: "How many tickets do you think are on the roll?" This question is simple enough that the kids can take a reasonable guess and get involved in the word problem. Dan encouraged "setting boundaries" when answering a word problem. For example "How many tickets is too low? too high?" This encourages students to validate that their "final" answer is a reasonable answer.
Follow Ups: "Take what was the answer and make it the new question." This approach, first of all, shows that Dan is engaged with his students and they are engaged in the discussion. I find this challenging sometimes, because I know what the "end" of the class is supposed to be and sometimes move forward with my own agenda. Learning this type of flexibility will be beneficial for me and, hopefully, for my students!
Dan's transparency about his own weaknesses is refreshing, also. I believe that teachers who act as if they do not make mistakes or attempt to cover their mistakes can sometimes expose their own insecurities. The fact that Dan is secure enough in his approach is transparent to me in a one hour webinar and certainly apparent to his students. I can only hope to be like Dan when I grow up :-)
Monday, August 23, 2010
Overcoming Fear of Math
I have always loved working with numbers and mathematics. In fact, I have often found myself working through complex math problems in my head while going out for a run or performing other activities. I can quite easily calculate the perfect square of any number from 1 to 100. In fact, I have sometimes challenged my math students to calculate any perfect square from 1 to 100 on their calculator than I can calculate it in my head. I rarely lose ...
So, fear of math is not a concept with which I easily identify. However, I readily acknowledge that all of my students do not come into my class excited about learning math. One thing that is true about fears or phobias is that fears often paralyze people to the point that they do not know what to do. Because they do not know what to do, they sometimes do nothing.
I have tried my best to alleviate these kinds of fears by breaking problems into simpler steps and getting students to perform the simple steps. Sometimes a student may be 'stuck' on a problem because they cannot perform a math operation such as "15 - 3". If I see a student stuck like that, I will hand them a calculator and tell them to use it if they need it. I see no reason for something this simple to paralyze one of my students.
Here is a video on math phobia which puts the onus on teachers to make math problems more practical real world problems than theoretical problems. I also found these tips for students to help students to reduce their own math anxiety by using a number of mental techniques to take the fear out of learning math. I believe that there is a find line between students having a legitimate fear of math and students not wanting to 'do' math because it is hard work. One of my jobs as a teacher is to push students who do not want to work but be sensitive to students who truly do get paralyzed by a problem.
I will comment separately on others' blogs about ways in which to possibly reduce math-a-phobia in some lesson plans.
Sunday, August 22, 2010
Linear System Student Activities
In Algebra 2, we spend a fair bit of time on understanding and solving linear systems. In task 2-2, I designed a student task about solving a linear system by substitution. Finding ways to keep students to keep students motivated and interested in creating, solving, and graphing linear systems can be challenging! This student activity is a linear systems game which is designed to make linear systems "fun". Here are a couple of interactive games using linear systems:
Make Your Own Linear Equation
Divide students into pairs. Have each pair choose three possible values of x and use each one to make an equation. For example, if x is supposed to equal 3, they can discover what 3x + 7 equals; their final equation will be 3x + 7 = 16. Have them write three of these equations on notecards and trade them with another pair of students. Challenge the pairs to solve their classmates' linear equations and see if the answers match up. Each matching answer wins a point for both pairs. Repeat this process with pairs trading with different pairs each round, and count up the points at the end to determine the winning pair. This game gives students the option of deciding which method they will use to solve a linear system and keeps it fun.
Graphing Linear Equations with Pictures
Most of my students cringe when they hear the word "graph". This game attempts to make graphing fun by using linear equations to create simple pictures on graph paper. Students will be asked to figure out ways to make various patterns or pictures, such as stripes (parallel lines--vertical, horizontal, and diagonal), a square, a triangle, a checkerboard pattern, and a diagonal checkerboard pattern. The lines will extend beyond the shapes. Each group can then write out the equations they discovered on a piece of paper and trade with another group.
Assessment
This will be graded as an alternative assessment task. For the first game, students will be hand in their note cards and be assessed based on the number and accuracy of the equations they created. They will also receive points based on their performance within the game. For the second game, students will be assessed based on the number and accuracy of the patterns they created. They will be assessed based on creativity and "neatness" of their patterns. And, they will be assessed based on identifying the correct linear equations corresponding to their drawing.
Friday, August 20, 2010
Do Computer Geeks Need Math, Too?
On Alan Skorkin's blog, he recently made a post titled "You Don’t Need Math Skills To Be A Good Developer But You Do Need Them To Be A Great One". In his post, he discusses whether it is necessary for computer scientists to have good math skills. My response to his post is shown below ...
I have my college degree in Mathematics - Computer Science and worked in the computer field for 20-plus years as a programmer, project manager, and IT director. In the last three years, I have shifted my career and am currently teaching high school mathematics. So, I read your post with great interest as I have experienced life from both the in-depth computer side and from the academic math side. Where do the two come together?
I have always made it a point to tell people that I majored in Mathematics - Computer Science, as Mathematics was always my first love academically, but Computer Science is where most of the employment opportunities exist. I have always believed that strong mathematics skills translate into being a good computer scientist. The mathematics skills to which I refer are not the memorizing of formulas and solving of specific textbook exercises, but the mathematics skills which take real world problems - aka, "word problems" - and use mathematics in order to solve them. The roots of this in my education go back to my high school Algebra 2 teacher who taught a unit on solving various types of word problems. After completing the unit, we had to complete 2 random word problems each day for the rest of the school year. (This was supplemental to our normal classroom assignment.) By the end of that year, we all knew how to do word problems!
In the computer field, though I spent a fair bit of time mastering the intricacies of various programming languages, I was never mesmerized with learning how to code, learning a new language, etc. I was always more interested in understanding the business problems which needed to be solved and then writing a computer program to meet those business needs. To me, this is an extension of the problem solving skills that I learned in high school mathematics. I believe that in today's computer science field, there are too many "geeks" who have a better relationship with their machines than with their colleagues! Just slide a piece of pizza under the door of their dimly lighted room every few hours, and they will be happy and productive! Yes, this is a broad generalization, but I believe there is a large need in the computer field for computer scientists to be just as avid about serving the needs of their users as they are avid about the depths of the technology.
When I teach problem solving in mathematics, the first step I teach is for students to read the problem and determine "What are you trying to find?" The last step I teach is to re-read the problem and determine "Did I answer the question?" The steps in between involve the mathematics skills to solve the problem at hand, but the first and last steps are the "customer service" component of the math class and relates perfectly to today's business world.
Today's business world could use more computer scientists who embrace and understand the relevance of mathematics to being successful computer professionals!
Thursday, August 19, 2010
Trigonometry According to Bloom
I spent some time analyzing Chapter 1 of my Trigonometry Textbook and analyzed it according to Bloom's task levels. Here's what I discovered ...
Chapter 1 covers eight different topics on the basics of trigonometry. These basics include Radian and Degree Measure, the Unit Circle, definitions of the Trigonometric Functions, Graphs of the Trigonometric Functions, Inverse Trigonometric Functions, and Applications / Models.
Each section of the book begins with some teaching of the basic concepts within the section. After introduction of the concepts within the section, there are a number of examples given which explore the concepts. As a general rule, most of the examples are "cookie cutter" fashion examples. For example, in Section 1.1 on Radian and Degree Measure, the first example regards sketching and finding coterminal angles. After showing the example the "Checkpoint" refers to Exercise 17 in the Exercises section of Section 1.1. Example 2 references Exercise 21 ... Example 3 references Exercise 47 ... and so it goes.
The first set of exercises in the section are Fill Ins to check on vocabulary concepts. These clearly fall within the Knowledge level of Bloom's Taxonomy. The next set of exercises provides problems in the Comprehension level of Bloom's. The next set ... starting with exercise 17, would likely be the Application level of Bloom's, since the student is asked to apply concepts which were demonstrated in the classroom exercises.
This particular section of the book has a total of 128 - yes, 128! - exercises. The subtitle in the textbook for the final set of problems is Synthesis. So, clearly, the textbook author has Bloom's model in mind when creating these exercises. Here is a sample problem in this last section:
A fan motor turns at a given angular speed. How does the speed of the tips of the blades change if a fan of greater diameter is installed on the motor? Explain.
Clearly, this final set of problems is asking the students to use the information learned in this section of the book in a different way in order to determine the proposed solution. This is a perfect example of the Synthesis level in Bloom's Taxonomy.
In fact, every section in this Trigonometry textbook has a "Synthesis" set of exercises included. So, I am pleased to say that a quick overview of this text shows that the authors do an excellent job in focusing on Bloom's levels throughout the exercises.
Unfortunately, I do not (yet) have an electronic version of this textbook, but Trigonometry is one of those classes which lends itself very well to visualization. There are many, many online videos such as this video on Solving Trignometric Equations which I will employ throughout my classroom instruction this year. I am looking forward to implementing these tools throughout the coming school year!
Math Tasks According to Bloom
Bloom's Taxonomy is a classification of learning objectives within education. Each subsequent level within Bloom's model represents progressive levels of higher order thinking skills. This entry focuses on mathematics tasks at each of the cognitive level of Bloom's taxonomy. First, I will provide a quick review of each of the Bloom's levels and then I will provide math tasks at each of the levels.
Knowledge
Analysis
Synthesis
Evaluation
Certainly, the Bloom's levels can sometimes seem "fuzzy" and a given task can be applied to different levels within Bloom's Taxonomy. But the above examples give a good overview of how mathematics skills can be used at each of the levels.
- Knowledge - This level focuses on learning terms, facts, methods, procedures, concepts.
- Comprehension - This level focuses on understanding uses and implications of terms, facts, methods, procedures, concepts.
- Application - This level focuses on practicing theory, solving problems, and using information in the new situations.
- Analysis - This level focuses on analyzing structure, recognizing assumptions, and breaking down material into parts.
- Synthesis - This level focuses on putting information together into new and creative ways.
- Evaluation - This level focuses on setting standards, judging with purpose, and accepting / rejecting ideas based on the standard criteria.
Knowledge
- Identify the thousandths place for the number 123.456789
- From a given data set, identify the mode, mean, median, and range
- Explain how to convert between fractions, decimals, and percents
- Classify polygons by regularity, line symmetry, and concavity
- How do you calculate the percent of a given whole?
- Solve for the area of a rectangle using the formula area = length x width
Analysis
- What methods can be used to compare and order fractions?
- What factors do you consider when formulating a plan for problem solving?
Synthesis
- Describe some patterns that you recognized in the construction of Pascal's Triangle.
- What predictions can you make from the given graph?
Evaluation
- Describe how to solve a problem using the 4 step method.
- Justify your reason for using the strategy you selected.
Certainly, the Bloom's levels can sometimes seem "fuzzy" and a given task can be applied to different levels within Bloom's Taxonomy. But the above examples give a good overview of how mathematics skills can be used at each of the levels.
Wednesday, August 18, 2010
Probability Student Task
The following lesson plan focuses on probability and the use of Excel spreadsheets to record data and display the data visually.
Essential Question: What is the real world probability of rolling certain outcomes with two dice?
Please Do Now:
Given two six sided dice, what is the probability of rolling the number 7 with the two dice? What is the probability of rolling 8? How do you know?
Lesson Steps:
Ticket Out the Door:
Submit your results, your graph, and your analysis (Question 4 above) for grading.
Essential Question: What is the real world probability of rolling certain outcomes with two dice?
Please Do Now:
Given two six sided dice, what is the probability of rolling the number 7 with the two dice? What is the probability of rolling 8? How do you know?
Lesson Steps:
- In groups of either two or three students, roll a pair of dice 36 times and record the results on a sheet of paper.
- Create a three column spreadsheet within Microsoft Excel. Column 1 should contain the numbers 2 through 12. Column 2 should contain the theoretical probability of rolling each number when rolling the two dice 36 times. Column 3 should contain the actual results when rolling the two dice 36 times.
- Create a graph of your own choosing comparing the true mathematical probability with the actual results of the experiment.
- Answer the following questions: Are the results the same or different? If different, why are they different? How would you expect the results to change when rolling the dice 10 times? 100 times? 1000 times? Why?
Ticket Out the Door:
Submit your results, your graph, and your analysis (Question 4 above) for grading.
Tuesday, August 17, 2010
Overview of Mathematica in Education
I attended the online seminar for Mathematica this afternoon. Since I have had very limited experience with Mathematica, I found this online demo to be very helpful.
Mathematica is an online tool which can be downloaded onto a local laptop and used for demonstrating various mathematical functions. Everything within Mathematica is live, interactive, and dynamic. There are three simple rules that one uses when creating functions to be demonstrated in Mathematica. Mathematica allows users to build interactive models which teachers can use to demonstrate the graphing of mathematical functions. In addition, these interactive models can be provided for students to use independently to perform exercises as assigned by teachers.
Mathematica is very flexible. For novice users, the website provides a large set of pre-built interactive models which can be used "as is" or which can be tweaked to be used in other ways. Mathematica also provides tools to allow models to be exported in various formats such as PDF format, etc.
I can see using Mathematica in various ways. First, it is a great tool for visually demonstrating math concepts in an interactive and dynamic way, complete with "slider" tools, etc., to easily change the function being illustrated. Second, I can see exporting a model to our school website as a resource for my students to use outside of class in order to "play" or learn more outside of class. Third, I can see exporting the models to various formats as a review tool which will allow students to prepare for upcoming classes or exams.
Types of Assessment in Mathematics
The following is a brief description of various types of assessment which can be used within the mathematics classroom:
For today's students, it is very important to use different types of assessments at different times. During classroom instruction, it is important to do intermittent formative assessments within a lesson to make sure that students are progressing toward the end goal of completely solving a mathematics problem. If they are stuck on step 2 of a 6 step process, they are done! So, teachers need to know if they understand step 2 before getting to the end of the 6 step process.
Constructed response assessments are helpful to allow students to "think outside the box" and apply a mathematics concept to the real world. Often times, these types of assignments are the ones that students remember for years to come. They may not remember how to construct a geometric proof, but they may remember the project they did to see how geometric concepts were used by the ancient Egyptians in constructing the Pyramids.
- Formative and Summative Assessment - Simply stated, formative assessment is assessment for the purpose of "forming" or guiding instruction. Types of formative assessment include conversation, observation, journal writing, and daily work. Summative assessment is assessment for the purpose of judging a student's mastery of concepts. Types of summative assessment include quizzes, tests, and standardized tests.
- Objective and Subjective Assessment - Objective assessments have a correct answer. Examples of objective assessment are multiple choice or true-false questions. In subjective assessments, the teacher's judgment determines the grade. In mathematics, this equates to multi-step problems which have a clear correct answer, but where the teacher grades and gives partial credit based on the knowledge the student displays through the problem solving process.
- Self-Assessment, Peer Assessment - Self-Assessment or Peer Assessment types of assignments are provided for quick student feedback. Examples include practice quizzes, practice written assignments, and other interactive exercises.
- Selected Response and Constructed Response - Selected Response is the same as Objective Assessment and includes the same examples as stated in (2) above. Constructed Response assessments are more conducive to the higher order thinking skills in Bloom's Taxonomy. Examples include a broad range of things, including essays and art projects. In the grading system at my school, one of the grading categories is "alternative assessment", and Constructed Response projects would fall into this category.
- Authentic and Standardized Assessment - Authentic Assessment includes a task for students to perform and a rubric by which their performance on the task will be evaluated. A great online example is included in this Authentic Assessment Toolbox created by Jon Mueller. Standardized Assessment are tests administered to large groups of students for the purpose of measuring academic achievement. The most common example used throughout the state of Pennsylvania are the PSSA exams.
For today's students, it is very important to use different types of assessments at different times. During classroom instruction, it is important to do intermittent formative assessments within a lesson to make sure that students are progressing toward the end goal of completely solving a mathematics problem. If they are stuck on step 2 of a 6 step process, they are done! So, teachers need to know if they understand step 2 before getting to the end of the 6 step process.
Constructed response assessments are helpful to allow students to "think outside the box" and apply a mathematics concept to the real world. Often times, these types of assignments are the ones that students remember for years to come. They may not remember how to construct a geometric proof, but they may remember the project they did to see how geometric concepts were used by the ancient Egyptians in constructing the Pyramids.
Driven Crazy with Data??
Most everyone would agree that the use of statistical data within the business world is commonplace and necessary in order to make appropriate business decisions in the an objective manner. A well-established business without sound financial data would cause most business analysts to raise their eyebrows about the viability of such a business. But, the use of statistical data within the confines of personal life, until recent years, has been rare.
Gary Wolf's article "The Data Driven Life" provides several examples of how the compilation of personal statistical data has changed some individual lives and has begun to change modern culture. One example is the mobile telephone, which is a small but tremendously powerful personal computing device with the capability to stay connected, but also with the ability to surf the web, to collect personal data, and much more. Another example is the personal accelerometer-based tracking system developed by Ken Fyfe. This device has been purchased by Adidas and Polar for use in sports watches to track various types of data related to one's personal physical fitness.
What are the implications of such data driven devices and lifestyles in the area of education? For me, the first implication is that educators cannot live in their own educational "bubble" and ignore the impact of such devices on today's kids. I teach in an urban school with a relatively low standard of living compared to the standard of living in the surrounding school districts. However, a significant percentage of my students could not imagine living without their cell phone and school policy has been changed to address the use of electronic devices within the school. (As a side note, even in my church, we as a congregation have been asked to turn off our cell phones during the service!)
One simple way for a math teacher to integrate this into a lesson is to provide a word problem which requires the students to compare various cell phone plans and determine which plan is best for them. Which plan is best if they do nothing but send text messages? Which is best for a family of four? Which is best for a family that has moved here from New York and uses their cell phone to regularly talk with their relatives in New York City? Suddenly, the world of mathematics becomes relevant for a high school kid!
There are also many opportunities to retrieve some of this personal statistical data and use it for graphing purposes and to draw conclusions based on the results. And it would not be difficult to create an extended exercise which asks the students to speculate about an area where the use of such personal devices would be beneficial.
The bottom line is that modern technology has made self-tracking - which was once the domain of the geekiest of humans - relatively normal. Wolf's article sums it up: "People are not assembly lines. We cannot be tuned to a known standard, because a universal standard for human experience does not exist." However, as Wolf also states, self-tracking through personal devices does make self-discovery much easier to do. And educators would be wise to integrate these devices into their classroom discussions on a regular basis.
Tuesday, August 10, 2010
Data Visualization Lesson Plan
Students have many different learning styles and one of the keys to being able to communicate effectively to a group of high school students is to teach in multiple learning styles. (I requested a class of students that all learn the same way that I do, but my request was denied!)
I have found for many of my students, basic concepts like working with fractions, working with negative numbers, finding a common denominator, or finding a least common multiple were still challenging concepts for a number of my students. The following Common Denominator Lesson Plan is visual, audio, and hands on. The verbal instructions are read through by the instructor with some "pie" visualization diagrams included along the way. These diagrams are used to show how, for example, how to find a common denominator for 1/3 and 1/4 and ultimately how to add these two fractions together. Finally, the lesson ends by giving the students an opportunity to use the visualization tool to find common denominators.
From Bloom's perspective, this lesson spends most of its time on the Knowledge, Comprehension, and Application levels. So, while this lesson is relatively simple from Bloom's perspective, it is effective in explaining a basic math concept. I could see extending this lesson by assigning an exercise which uses the Common Denominator concept in a more comprehensive lesson which incorporates the Evaluation and Synthesis levels in Bloom's Taxonomy.
Monday, August 9, 2010
Data Visualization Tools
Pie charts, bar graphs, and tables are commonly used data visualization tools. Data visualization tools fall under the broader category of "visualization" tools. Following are five less common visualization tools which can be used in teaching today's mathematics students.
1. Flowcharts
As an "old school" computer program, flowcharts are a tool with which I have been intimately familiar. Flowcharts are a great tool for teaching mathematics because most of mathematics involves breaking a big problem into smaller problems to be solved. Often times when working through a new concept, I will introduce the concept pieces at a time before putting it all together. For example, when doing an Algebra unit on the Quadratic Equation, the first lesson will likely be putting an equation in standard form (box 1 of the flowchart) and identifying the A, B, and C values (box 2). One of the last steps would be using the value of the discriminant (b^2 - 4ac) to evaluate the type and number of solutions for the given quadratic equation.
2. Gantt Chart
A Gantt Chart is often used in project management to provide a visual representation of the tasks involved in a larger project. The Gantt chart is useful because it shows a linear progression of all the mini-tasks included in the project. It shows the amount of time required for each task, the interdependency among tasks, and tasks which are independent of one another.
In math class, a Gantt Chart could be used to show the students the course "map" throughout the year. A Gantt Chart could be created for each individual chapter of the book. A global Gantt Chart could be created to show the overall plan for the course. Periodically throughout the year, the Gantt Chart could be referenced to show the students "how far we have come" so far in the course.
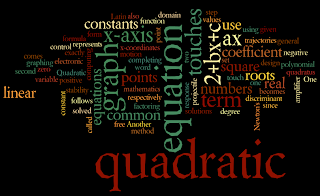
3. Wordle
Wordle is a data visualization tool which will generate "word clouds" from a block of text generated by the user. Words which are used more frequently are shown more prominently in the word cloud, usually meaning that they are shown in larger font. Wordle encourages creativity by allowing the user to specify different fonts, color schemes, and layouts. It is easy to learn, quick to create a new image, and fun!
In mathematics class, wordle could be used in a similar way to a "Word Wall" to summarize the concepts studied in a chapter or within a course. It provides students a great visual reminder of the most important concepts within the unit.
Here is an example of a Wordle Chart created from the Wikipedia page on the Quadratic Formula:
4. Venn Chart (Diagram)
A Venn Chart, often also known as a Venn Diagram, shows logical relationships between a collection of related things. The relationships are pictured by creating a set of overlapping closed circles and including the property in the appropriate circle(s).
A great example in mathematics would be to create a Venn Diagram with three circles: even numbers, odd numbers, and prime numbers. Then, have the students go through an exercise using the numbers 1 through 30 and placing each number in the appropriate place in the Venn Diagram.
A completed Venn Diagram gives an overall picture of the relations in the original collection of objects.
5. Interactive History Timeline
An Interactive History Timeline like the one highlighted here gives a "big picture" of the history of a specific topic and allows the user to zoom in for more detail on specific topics. Though I would not envision this being used extensively in mathematics, I see where it could be useful in studying a survey of the history of mathematics.
1. Flowcharts
As an "old school" computer program, flowcharts are a tool with which I have been intimately familiar. Flowcharts are a great tool for teaching mathematics because most of mathematics involves breaking a big problem into smaller problems to be solved. Often times when working through a new concept, I will introduce the concept pieces at a time before putting it all together. For example, when doing an Algebra unit on the Quadratic Equation, the first lesson will likely be putting an equation in standard form (box 1 of the flowchart) and identifying the A, B, and C values (box 2). One of the last steps would be using the value of the discriminant (b^2 - 4ac) to evaluate the type and number of solutions for the given quadratic equation.
2. Gantt Chart
A Gantt Chart is often used in project management to provide a visual representation of the tasks involved in a larger project. The Gantt chart is useful because it shows a linear progression of all the mini-tasks included in the project. It shows the amount of time required for each task, the interdependency among tasks, and tasks which are independent of one another.
In math class, a Gantt Chart could be used to show the students the course "map" throughout the year. A Gantt Chart could be created for each individual chapter of the book. A global Gantt Chart could be created to show the overall plan for the course. Periodically throughout the year, the Gantt Chart could be referenced to show the students "how far we have come" so far in the course.
3. Wordle
Wordle is a data visualization tool which will generate "word clouds" from a block of text generated by the user. Words which are used more frequently are shown more prominently in the word cloud, usually meaning that they are shown in larger font. Wordle encourages creativity by allowing the user to specify different fonts, color schemes, and layouts. It is easy to learn, quick to create a new image, and fun!
In mathematics class, wordle could be used in a similar way to a "Word Wall" to summarize the concepts studied in a chapter or within a course. It provides students a great visual reminder of the most important concepts within the unit.
Here is an example of a Wordle Chart created from the Wikipedia page on the Quadratic Formula:

4. Venn Chart (Diagram)
A Venn Chart, often also known as a Venn Diagram, shows logical relationships between a collection of related things. The relationships are pictured by creating a set of overlapping closed circles and including the property in the appropriate circle(s).
A great example in mathematics would be to create a Venn Diagram with three circles: even numbers, odd numbers, and prime numbers. Then, have the students go through an exercise using the numbers 1 through 30 and placing each number in the appropriate place in the Venn Diagram.
A completed Venn Diagram gives an overall picture of the relations in the original collection of objects.
5. Interactive History Timeline
An Interactive History Timeline like the one highlighted here gives a "big picture" of the history of a specific topic and allows the user to zoom in for more detail on specific topics. Though I would not envision this being used extensively in mathematics, I see where it could be useful in studying a survey of the history of mathematics.
Saturday, August 7, 2010
The ABC's of PLN
The Educator's PLN - or Educators' Personal Learning Network - is a social networking website targeted for the teaching population. The site includes a collection of videos, forums, videos, groups, and blogs specific to the education populations. Two specific things I found within 10 minutes of being on the site are this video on Bloom's Taxonomy and a group on Google Tools for Teachers. The former video is an amusing video using various clips from the Pirates of the Caribbean movie to illustrate Bloom's Taxonomy. The latter is a user forum regarding various ways to use Google and its toolset - Google Docs, Google Apps, etc. - within education.
I anticipate this site as an excellent forum for interacting with other teachers in a collaborative fashion and brainstorming about various ideas for my classroom. In particular, I am becoming more and more convinced of the need to regularly include videos in my classroom as part of the classroom instruction. There are many great instructional videos and funny videos available on this site and on the internet, in general. Today's students love to use youtube and I intend to use these tools within my classroom on a regular basis this coming school year.
I do not view myself as very creative, but I am really good at sharing or "borrowing" good ideas from others, so a site like this is an excellent resource which will allow me to be a more effective classroom teacher.
Symmetry in the Real World
Essential Question: How is symmetry used in the real world?
Steps:
1. Introduce the idea of symmetry with several examples of simple geometric objects (squares, rectangles, triangles), letters of the alphabet (A, D, E, etc.) which exhibit symmetry. Show some examples of real world objects which exhibit symmetry. DO NOT give students a definition of symmetry, but show examples and draw lines of symmetry in the examples given.
2. Student task: based on the examples shown, write your own definition of symmetry.
3. Compare your definition of symmetry with the definition given at the following website: Line of Symmetry Definition. How is your definition the same as the one given online? How is it different?
4. Complete this Online Symmetry Exercise to better understand symmetry in Geometry.
5. Find a real world example of symmetry. Provide either a picture or a drawing depicting your image and explain what it is and where you found it. An example would be one of the car logos referenced in this blog site.
6. Design your own image of symmetry for a real world object - either real or imaginary - of your choosing.
Assessment:
Students will submit their definition of symmetry and the comparison of similarities / differences.
Students will submit their real world example and the object which they created.
Here is how this lesson lines up with my education goals.
1. Teach students basic concepts and skills. This is a great introduction to the math concept of symmetry.
2. Teach students in engaging ways. Kids love the web. This exercise gives them hands on opportunities to explore on the web and create their own symmetric designs.
3. Apply math skills to real world problems. The students identify real world uses of symmetry.
4. Teach students problem solving methods. There are no explicit problem solving techniques in this problem, but exploring the web to solve this problem is one way in which students will solve problems in the real world.
5. Teach students to work in collaborative ways. As part of this project, students will work on computers and will likely collaborate with other students on their task. This is not a 'team' project, but it does encourage working with others.
Geogebra: The Midpoint Formula
I will be teaching Geometry for the first time this year ... hooraaaay!! So, I opened up my Geometry book to one of the first lessons we will be doing and created a Geogebra application which walks through the steps necessary to calculate the midpoint M of a line segment AB. Since I have never used Geogebra actively before, this exercise was very helpful in getting my feet wet with a relatively simple application. I anticipate using Geogebra a LOT this school year :-)
Thursday, August 5, 2010
An Evening with Don Cohen
I attended the live webinar on Calculus for 7 Year Olds (yes - 7 year olds!) hosted by Maria Droujkova and featuring Don Cohen - the Mathman - an 80 year old man who has been working with young people to help them understand the basics of high level mathematics for years.
Don is a very humble, engaging man who reminded me of my college cross country coach, Gene Shirk, who at age 80 in 1981 was the oldest active coach at any level in the NCAA. Coach Shirk would tell our teams story after story of his life experiences - from his trip to the 1936 Summer Olympic Games where he saw Jesse Owens interchange with Adolf Hitler to his time as a two term mayor of the city of Reading, PA - and relate them to cross country running. From a one hour webinar, I suspect that Don's conversational style would yield very similar stories in regards to mathematics.
Don does not refer to himself as a "mathematician", but rather one who "listens to his students" and helps them to learn math concepts by visualization and helping them "learn to learn". His youthful enthusiasm and excitement about his students accomplishments are testament to how he approaches life. He is certainly an inspiration to his students and to those of us who have only met him for one hour in an online webinar!
Wednesday, August 4, 2010
Critique: Symmetry Lesson Plan
I found this Symmetry Lesson Plan online and, while it is not a "traditional" classroom lesson plan, a webquest is a great way for students to explore on their own and have fun learning along the way.
The teacher could use the Introduction as the "launching point" for the webquest and give the students some direction as to what the task is about and how much class time will be available for the students to work on the webquest.
The Task, Process, and Resources allow the student to explore many different aspects of symmetry in a fun, online way. While the student is free to explore on the web, the quest is structured well enough so that the students will stay within the bounds of the project as they work through it. There are many links along the way which will allow the student to explore in different directions, still within the parameters of the task. The grading rubric is easy for the students to understand and clearly sets the teacher's expectations for the task.
The Conclusion piece allows the instructor to tie things back together at the end of the lesson.
To me, this seems to be a great "Alternative Assessment" lesson or a lesson that gives the students a break from the rigors of the normal everyday math class and helps to make math real, relevant, and fun!
A Critique: van Hiele Levels
I found the following article on van Hiele's Levels of Geometric Understanding. What I found interesting is that van Hiele's levels seem to relate very closely to the Cognitive Domain of Bloom's Taxonomy, in that the lower levels speak generally to students' ability to identify figures and their properties, which relates closely to the Knowledge and Comprehension levels in Bloom's. The higher levels in van Hiele seem to relate more closely to the Synthesis and Evaluation levels in Bloom's, and are evidence that students are exhibiting higher order thinking skills.
An interesting set of questions posed in this article relate to how a teacher can be at a different van Hiele Level and still be able to teach at the students' individual levels. To me, this is the essence of what it means to be a professional teacher. One can go through school as a stellar mathematics student, but be unable to teach what they know to students with different learning styles from their own. Or, an "average" mathematics student could be the world's best teacher because they understand that each of their students have a different learning "language" and are able to vary and differentiate their instruction in order to speak to all of their students in their own language.
A revealing quote in this article regarding the implications of van Hiele's theory on instructional practices is this: "... using lecture and memorization as the main methods of instruction will not lead to effective learning. Teachers should provide their students with appropriate experiences and the opportunities to discuss them." Well said!
Even though van Hiele's levels provide broad generalizations of students' learning levels, I believe that they can be best applied to individual students at the individual task level. A student may be at Level 4 (Deduction) for yesterday's task and at Level 1 (Visualization) for today's task. In fact, this should not be surprising at all, since many times mathematics involves mastering a task one day and moving onto a new task the next day. Hopefully, as a student's knowledge builds based on prior knowledge, they can quickly step through the lower levels to the higher levels. And certainly, based on the subject matter, a student can be at different levels of understanding at the same time in their life. There are many possible reasons for this, but it should not be at all surprising.
As I think about van Hiele's model, I view it as an extension of Bloom's Taxonomy which can relate more directly to the study of Geometry. Because I will be teaching geometry for the first time this fall, the timing could not be better for me to be exposed to this model!
Linear Systems Lesson Plan Critique
I found the following lesson plan on Solving Linear Systems by Graphing.
This lesson plan is clearly more detailed than the lesson plans which I currently use ... in fact, it is very comprehensive. I use many of the same elements in the lesson plans that I create. The Warm-Up used here is similar to what I call a "Please Do Now" or PDN for short. I begin almost every class with a PDN activity, which recalls prior knowledge and generally links today's lesson to the prior day's lesson. Though I do have a daily agenda for my students, I do not post that for the students. However, I do have on my whiteboard the day's Essential Question, the state standards being taught for the day, and the day's homework assignment. The closure of my lesson each day usually includes either time to begin working on a homework assignment or a "Ticket Out the Door", or TOD, which the students will hand to me before they leave class.
As a way of tying a lesson together, all of the classes in our school use the "Essential Question" (EQ) format. If done properly, the EQ is a question that the students cannot answer at the start of the lesson, but can answer at the completion of the lesson. In the lesson presented here, there are multiple assessments as part of the lesson, which (hopefully!) will ensure that each student is able to answer the EQ at the end of the lesson.
In this lesson, I do like the practical example presented. Certainly, "When am I going to use this?" is one of the most common question asked of math teachers, and this teacher addresses it well! I also like the supplementary video presented here. Granted, it is 45 minutes long, which is far beyond the attention span of most students. But there are many great teaching videos online, and with today's generation of students, it is wise to take advantage of the ways in which our kids learn!
Linearity in Algebra: A Lesson Plan
In teaching Algebra 2, one of the areas where we spend a fair bit of time is solving linear systems of equations using three different methods: 1) graphing; 2) substitution; and, 3) elimination. This mini-unit will be for solving linear systems using substitution.
Task: Design a student task or mini-unit centered on understanding linearity.
Essential Question: How do I solve a linear system using substitution?
Lesson Steps:
1. "Please Do Now (PDN)" - Solve equation 1 for y: 2x - y = 2
2. Review PDN with students.
3. Add equation 2 to the equation 1 to make a linear system: x + 6y = 27
4. Walk through the Algebra steps to substitute the PDN solution into equation 2 to solve for x.
5. Walk through the Algebra steps to substitute x into equation 1 and solve for y.
6. Walk through the Algebra steps to check the solution in both equations.
Assessment:
Homework assignment: For each linear system given, identify the equation and variable for which you will solve as step 1 in substitution. Walk through the steps to solve for that variable in the equation.
Closure / Ticket Out:
At end of this multiple day lesson, students will complete and hand in a solved system of linear equations.
------------------------------------------------------------------------------------------
Note that this is a multiple day assignment, so I would start this lesson by giving an overview of linear systems based on what we did in solving systems by graphing. We will also discuss that some linear systems have no solutions (parallel lines) and some have an infinite number of solutions (same line). Homework assignments will break the steps into pieces until the students are able to fully solve a linear system using substitution.
Tuesday, August 3, 2010
Calculators: What are they Good For??
In his paper on Linearity in Calculus, Dan Teague wrestles with the question of knowing one's audience when teaching calculus. In particular, there is a growing dichotomy between those students who have a strong calculator-based precalculus experience and those who do not.
By giving students a visual view of a function, graphing calculators have made it relatively easy to determine whether or not a function is linear. The question with which Teague wrestles is this: How can such an approach strike the proper balance between providing enough rigor for practicing mathematicians and enough information for those students studying calculus as part of their general education?
The approach developed for use at the North Carolina School of Science and Mathematics takes advantage of the use of graphing tools in preparatory calculus courses. Students can use the graphing calculator results as launching point into differential calculus. Thus, this approach lays a good foundation for those students who will take more rigorous mathematical classes.
Should calculators in general, and graphing calculators in particular, be used in such classes? (Interestingly, this is one question I was asked during my job interview for my current teaching position.)
On the con side, if students are using calculators in class, are they truly demonstrating their knowledge of the mathematics being taught? For example, if I am teaching a section on simplifying radical expressions, when I ask students to simplify the square root of 48, I often will get 6.928 as an answer. The correct answer, based on the classroom instruction, is 4√3. The first answer is "correct" according to the calculator, but it does not demonstrate the mathematical knowledge which is being tested. In addition, a calculator will rarely return the negative root solutions to such a question. What is the square root of 49? Many students will say "7", but "-7" is also a valid solution and a calculator will not provide this result. As an instructor, I must become very specific in communicating my instructions and expectations when testing for such knowledge.
On the pro side of using calculators, almost every electronic device which one owns these days has a built in calculator. Cell phone, watches, computers, IPOD's ... calculators are everywhere! So, why not take advantage of them? After all, isn't 6.928 close enough to the square root of 48? 6.928 squared results in 47.997184 ... isn't that close enough to 48? For most of our students and for most of society, the answer is "Yes, this is close enough". And for most practical causes, it truly is close enough.
As a mathematics teacher, I have had to find the balance between acknowledging the technology is readily available and accessible while insisting that my students demonstrate math knowledge. In our state standard exams, students are not allowed to use calculators for the first few math section questions. Once they have completed that section, calculators are allowed to be used. I take a similar approach in my class by allowing calculator use in cases where it does not undermine the fundamental knowledge being tested.
Saturday, July 24, 2010
Bloom's Taxonomy
I am relatively new to the teaching profession, so the first time I heard about Bloom's Taxonomy, it made sense to me. But I knew little about its origins. Like many things in education, there are strong feelings both for and against many educational concepts. There are those educators who are true believers and avid users of Bloom's Taxonomy and those who abandoned its use years ago.
One proponent of Bloom's Taxonomy states that it is the first idea taught in educational classes and the root of most ideas in education. One commenter to this blog notes a "love-hate" relationship with Bloom, as every lesson plan had to be written with elements of Bloom's.
One opposing view of Bloom's Taxonomy by Dr. Brenda Sugrue argues that Bloom's taxonomy is not supported by any research on learning. Sugrue also argues that the six levels in Bloom's taxonomy cannot be consistently applied to learning objectives. As an alternative to Bloom's, Sugrue presents a Content-Performance Matrix.
I believe that utilizing Bloom's taxonomy in algebra and calculus tasks can be very beneficial. When students come out of these classes, the ultimate goal is that the mathematics that they learn will be applicable to their lives in the "real" world. So, students should not only be able to recall and repeat algebra and calculus formulas, but they should be able to apply them. So once students have basic definitions and comprehension (Bloom's levels 1 and 2), they should be able to move to the higher levels of thinking. For example, in Algebra, once we finished the three different methods of solving linear systems, I engaged my classes in a discussion as to which of the three methods they liked best. For most students, it amounted to "I like method X because it's the fastest / easiest". Even with that type of statement, these students have moved to the Analysis level of Bloom's Taxonomy. As one moves to more complex mathematics such as Calculus, the thought processes can become more abstract and much of the work will be in the upper levels of Bloom's taxonomy.
So, overall, I believe that Bloom's taxonomy has as much usefulness in any level of mathematics as it does in other subject areas.
Wiki World!
Today was my first venture into editing a page within Wikipedia and I found it to be a relatively easy learning curve. Wikipedia is amazing in that anyone in the world can edit a Wiki page with seemingly nobody to review / approve edits before they are posted for the world to see. It is a self-policing community.
I updated the page created by Maria Drujkova on Multiple Representations. In particular, I added links to half a dozen other Wikipedia pages to make Maria's page a bit richer.
Great experience!
Doug
I updated the page created by Maria Drujkova on Multiple Representations. In particular, I added links to half a dozen other Wikipedia pages to make Maria's page a bit richer.
Great experience!
Doug
Friday, July 23, 2010
Problem Solving Article Review
I read the article “Teaching Students Math Problem-Solving Through Graphic Representations at the following website: Math Problem Solving. The premise of the article is that graphic representations can be used to teach students with learning disabilities to be effective problem-solvers. While the article focuses on students with learning disabilities, these techniques can be used for a more general student population.
The first phase of problem solving is for students to identify the problem type and then to organize and represent the key information in a graphical way using schematic diagrams. The second phase is to solve the problem by selecting and applying the appropriate mathematical operations based on the problem type. The article shows that using graphic representations to emphasize conceptual understanding can help children to solve problems. After the students have created their graphic representations, they put together a plan to solve the problem.based on the type of word problem being solved.
The article then goes on to advise teachers on how to evaluate students’ problem solving performance. Teachers are encouraged to examine students’ completed tests not only for correct solutions but also for strategy use. If students are consistently getting stuck at one point, more instruction should be provided.
The reported results of this problem solving method for students with disabilities in elementary and middle schools have been good. Students have shown dramatic improvements in problem-solving scores, have maintained their new skill set for up to four weeks, and have also had more positive attitudes toward strategy instruction. Teachers have also reported more effective problem-solving in their classes.
Again, though this article targets students with disabilities, I believe that these skills are more far reaching than just for students with disabilities in elementary or middle schools.
Thursday, July 22, 2010
Linear Systems - Exercises vs. Problems
Linear Systems
Definition: A System of Two Linear Equations in two variables x and y, also called a linear system, consists of two equations that can be written in the following form:
Ax + By = C Equation 1
Dx + Ey = F Equation 2
Dx + Ey = F Equation 2
A solution of a system of linear equations in two variables is an ordered pair (x,y) that satisfies each equation.
In Algebra 2, there are three different ways to solve linear systems:
- Solve by Graphing
- Solve by Substitution
- Solve by Elimination
Here is a link to an applet used to graph and solve linear systems: Linear Systems Applet. The screen shot is here:

Here are some textbook “recipes” for solving linear systems by two of the three methods:
The Substitution Method

The Elimination Method

Here is a problem which requires applying the knowledge learned by solving linear systems. Note that this also addresses the area of multiple representations, discussed in Week 1.

Thursday, July 15, 2010
Multiple Representations
The following PowerPoint presentation explains the significance of multiple representations in the teaching of mathematics: www.pictorialmath.com/updates_downloads/PresenterGuide.ppt
The primary website is www.pictorialmath.com.
This PowerPoint presentation gives an overview of multiple representations. For example, it discusses eight widely used representational systems in the teaching and learning of mathematics:
This is an excellent paper. What I find interesting is that, with the exception of the three examples presented, most of this PowerPoint presentation is targeted towards oral learners, as there are LOTS of words and very little else used in this presentation. As an oral learner myself, I find this appealing, but I have found that even adding a few pictures to slides makes them more attractive and helps many students to learn better.
The primary website is www.pictorialmath.com.
This PowerPoint presentation gives an overview of multiple representations. For example, it discusses eight widely used representational systems in the teaching and learning of mathematics:
- Written symbols
- Descriptive written words
- Pictures or diagrams
- Concrete models / manipulatives
- Concrete / Realia
- Spoken language / Oral representation
- Experience-based
- School word problems
This is an excellent paper. What I find interesting is that, with the exception of the three examples presented, most of this PowerPoint presentation is targeted towards oral learners, as there are LOTS of words and very little else used in this presentation. As an oral learner myself, I find this appealing, but I have found that even adding a few pictures to slides makes them more attractive and helps many students to learn better.
Blockfest Webinar
I attended the Blockfest webinar on Wednesday July 14th. The primary presenter discussed an organization which hosts "Blockfests" in various places around the country. A Blockfest is an event targeted towards children ages 2-8 and their parents. The children are broken down into smaller play groups, each of which has a trained moderator to work with the parents and help to relate the "block play" to mathematical concepts. The idea is to begin planting the seeds of mathematics in students at early ages. The events have been successful. "Success" for the parents means that they are learning how to interact with their children and begin to plant the seeds of mathematics concepts at an early age. "Success" for the children means they have had fun playing with blocks and their new friends for the duration of the event.
Though I teach high school mathematics, I believe that making math relevant and fun at early ages is a wonderful way to plant seeds of learning that make math fun. The more opportunities to make math fun at early ages, the more likely students are to engage in mathematics in elementary school and high school ages. I see many students who come into class with the attitude "I can't do math" from Day 1 of the year. I believe an event like Blockfest is one good way to counteract this kind of mindset.
Though I teach high school mathematics, I believe that making math relevant and fun at early ages is a wonderful way to plant seeds of learning that make math fun. The more opportunities to make math fun at early ages, the more likely students are to engage in mathematics in elementary school and high school ages. I see many students who come into class with the attitude "I can't do math" from Day 1 of the year. I believe an event like Blockfest is one good way to counteract this kind of mindset.
Wednesday, July 14, 2010
Math Education Goals
Five Important Goals of Secondary Math Education
1. Teach students basic concepts and skills of the course which they are studying.
2. Teach students in engaging ways that they will remember in the future.
3. Teach students to apply math skills to real world problems.
4. Teach students problem solving methods which go beyond the mathematics that they are learning.
5. Teach students to work in collaborative work to simulate real world work situations.
Subscribe to:
Posts (Atom)